Alhadaqa
Turn mistful data into insightful art
Here, I explore data, looking for its hidden secrets and its mysterious stories. I discover those secrets, then reveal them in a beautiful, simple and insightful data visuals.

MOHAMAD WAKED
Salam, I’m a Mechanical Design Engineer who turned into a Data Scientist, then into a Data Visualization Designer and recently a Data Journalist.
I have an extreme passion towards analyzing data, exploring its dark sides, examining it from different angles, breaking it down till roots, understanding the connections between its small dots, discovering and uncovering its deep secrets, then summarizing those findings in a graph that is pleasing to its viewer. I founded ALHADAQA which is my personal DataViz Lab. Here I am expressing part of my passion towards data exploration and data visualization.
My short story
from Mechanical Design to Data Visualization Design
I graduated as a mechanical design and production engineer from Ain Shams University in Cairo, Egypt. From my childhood until now I’m chasing my passion for designing things and playing with numbers.
YOU CAN DO ANYTHING AS LONG AS YOU HAVE THE PASSION, THE DRIVE and THE FOCUS.
During my early career in the automotive industry as a process analytics engineer, I gradually shifted my practical and scientific focus to data science. I also had the opportunity to enforce my back by getting my specialization in Data Science from Johns Hopkins University.
I was consciously observing my delight when it came to presenting the results of any analysis in a chart or graph. It is always the point where all my mental potential is unleashed. This was the main driver behind my second shift to data visualization design.
Small change can make a big impact.
Because we live in the data and information age, I felt that anyone who has the ability to simplify and transform data into something that can help people in one way or another is socially responsible in his place.
So, I decided to create ALHADAQA to become my personal DataViz Lab, to people and for people.
I don’t know if I’m chasing data or data is chasing me.
My life revolves around data. Beside my main job as a data scientist, I try to manage my time to work on my personal data visualization projects or experiments and sometimes it could be a project for a client. Add to that my recent part-time career as a data journalist.
Freedom, in any case, is only possible by constantly struggling for it.
Albert Einstein
I’m always trying to escape from what is limiting my vision. I like to work freely on my projects, from conception to publication. That’s why on every project, I enjoy my constant struggle through many tasks, which include ideating, scoping, data collecting, cleaning and analyzing, sketching, innovating, designing, coding, illustrating, writing and publishing.
Awards

BRONZE IN INNOVATION
MALOFIEJ AWARDS | 2020

The best visual and data-driven story
The pudding cup | 2020
Shortlist
SIGMA Awards | 2020

Gold Medal
Center for global data visualization challenge | 2019

The best Data visualization
ARAB DATA JOURNALISTS NETWORK Awards | 2018
Featured on
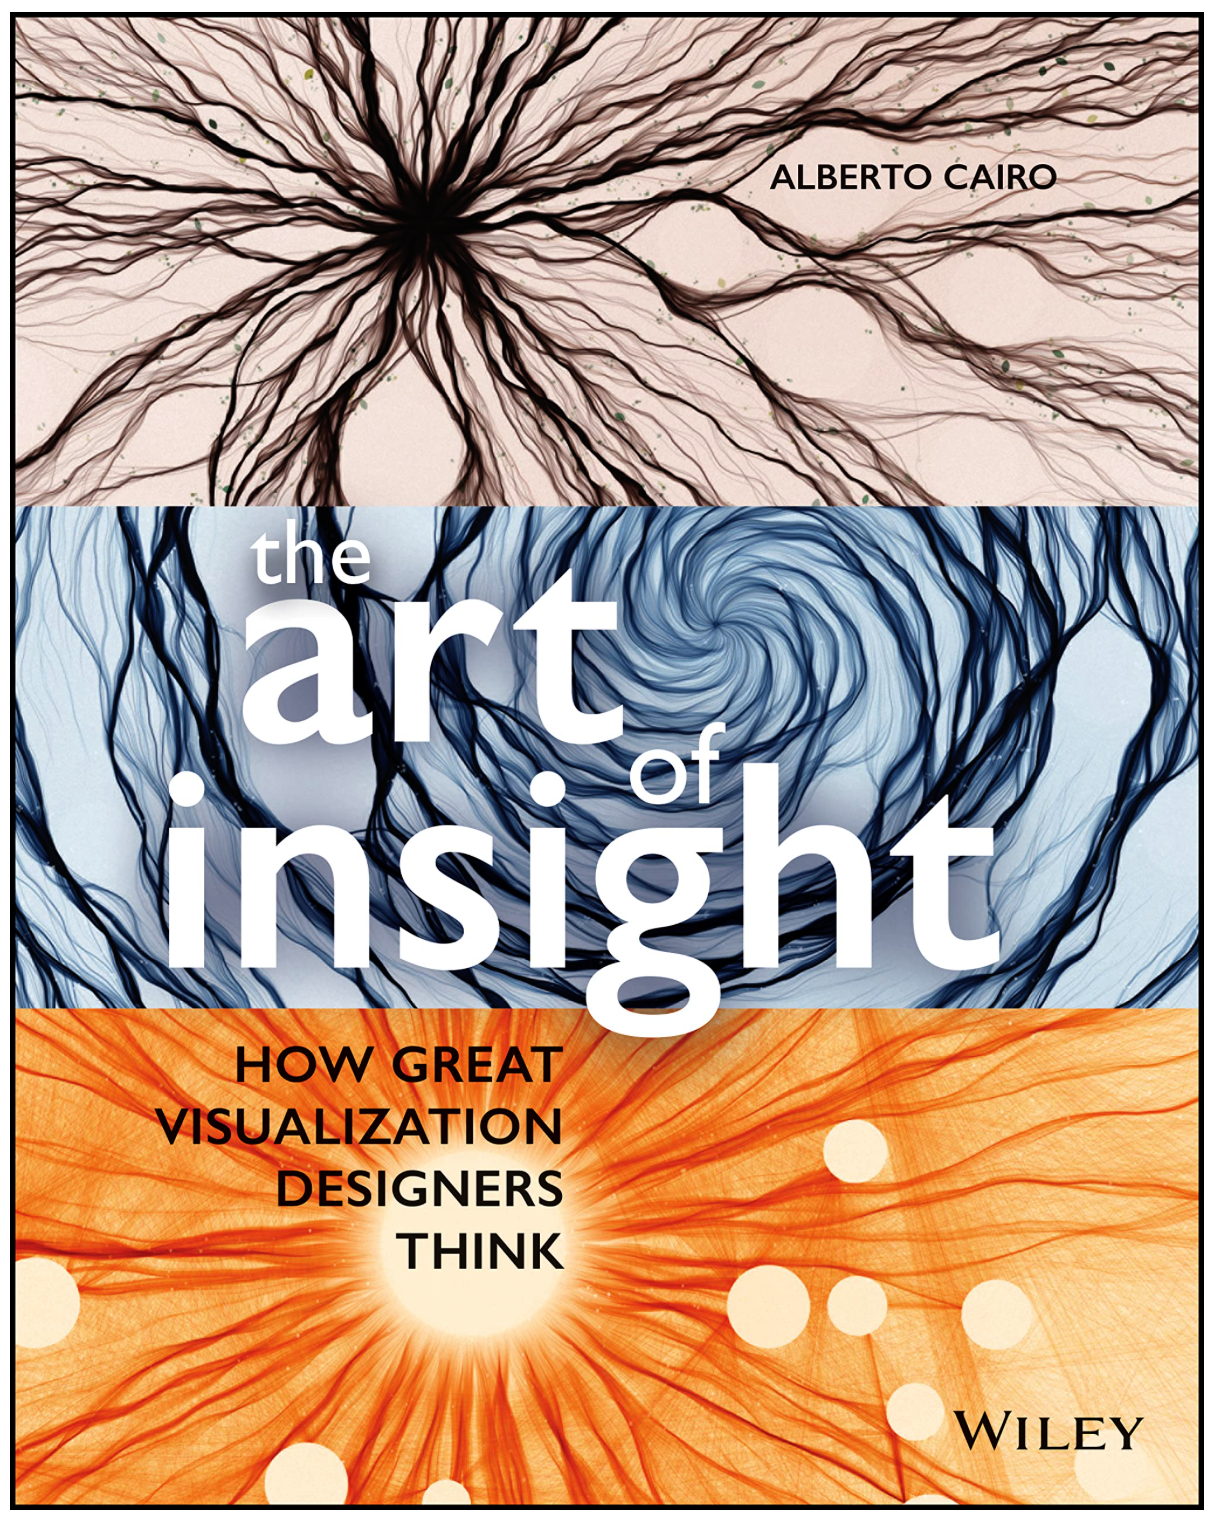
The Art of Insight
How Great Visualization Designers Think
By Alberto Cairo
With great pleasure, Alberto Cairo interviewed me to be a part of his new book “The Art of Insight” among a group of great data visualization designers around the world.
INTERVIEWS
-
Make Your Data SPEAK, Interview with Natalia Kiseleva, 2023.
-
The Plot, Interview with EVELINA JUDEIKYTE, 2023
Other Appearances

-
Global Investigative Journalism Network, Data Journalism Top 10, 2023.
-
Data Visualization Blog, Best on the Web Series, by Andy Kirk, 2020.
-
Global Investigative Journalism Network, Data Journalism Top 10, 2020.
-
Data Visualization Society, 2020.
-
TiBS | Tiroler Bildungsservice, 2020.
-
Naked Data Newsletter, 2020.
-
Data Visualization Blog, Best on the Web Series, by Andy Kirk, 2019.
-
DIKAYO DATA, Data Reveal, 2019.
-
The Functional Art Blog, by Alberto Cairo, 2019.
-
Visualizing Data Blog, Best on the Web Series, by Andy Kirk, 2019.

